
en

Analyze your pay gaps, ensure compliance, and empower your employees with the first end-to-end platform for pay transparency







Get started
Step 1
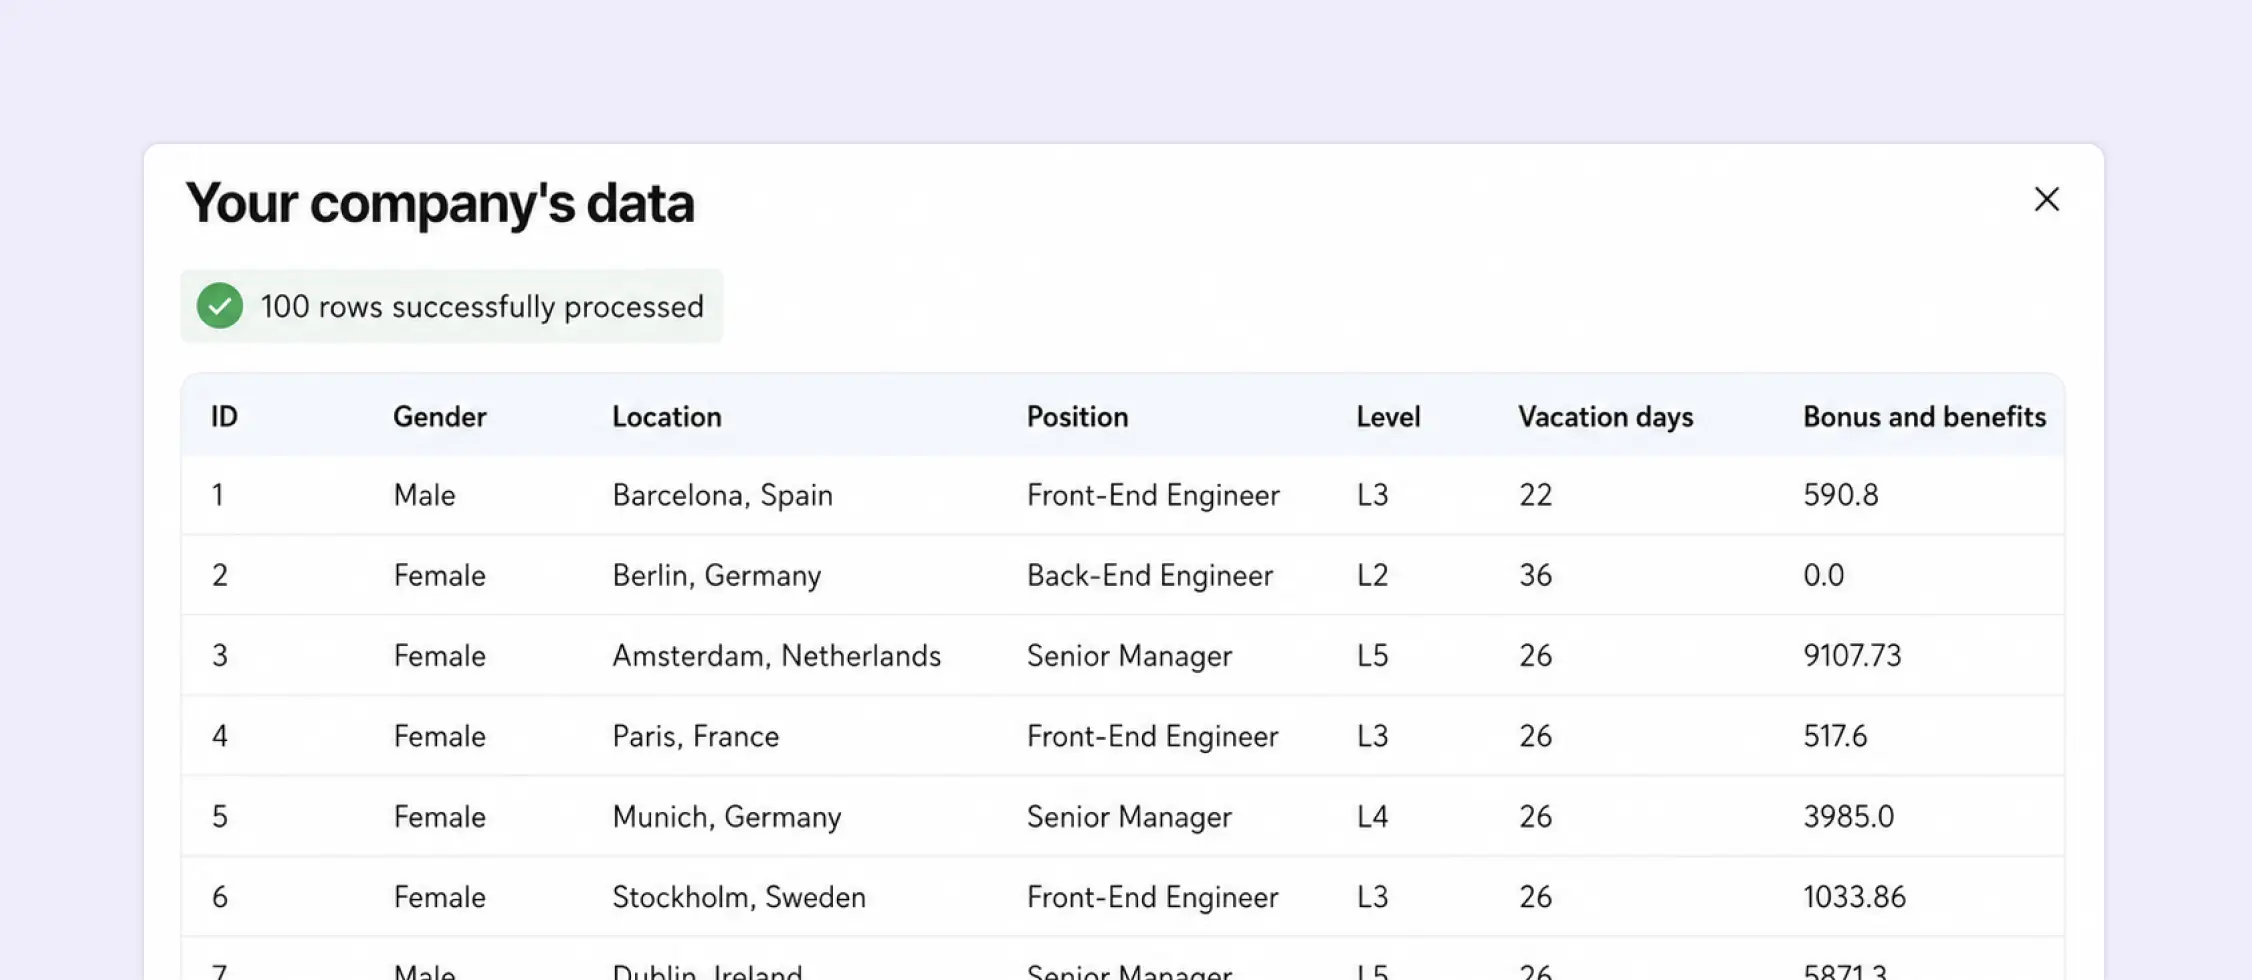
Upload your data
CSV or Excel file — the platform guides you step by step
Step 2
Validation & preview
The platform detects errors before running the analysis
Step 3
Analysis & insights
Dashboard, employee view, compliance, AI Insights
Features
• Pay gap dashboard
The dashboard shows key pay gap metrics, salary distribution by gender, job level, and location. AI Insights displays conclusions in real time

Raw gap — mean and median
Including / excluding days off
Including / excluding bonuses
Distribution by job level


• Job level analysis
Move from the overall picture to specific job levels (L1–L5) and instantly see which have the largest gaps — with an employee list at each level compared to the average
Salary distribution — box plot
Women & men stats at level
Employee list + deviation from avg
Adjusted pay gap data — table
• Individual employee view
Enables HR and HRBPs to hold data-backed salary conversations. Shows the employee's position against pay band for their level and comparison with women's and men's medians
Base and base+bonus salary
Position within L4 pay band
Comparison with women's & men's median
Salary history over time
AI Summary + review salary equity


• Advanced analytic
Understand where the gap comes from — Oaxaca-Blinder decomposition splits the gap into explained and unexplained components. Methodology is selected automatically
Unadjusted pay gap — salary distribution
Adjusted pay gap — waterfall chart
Oaxaca-Blinder decomposition
Risk Groups table (Critical/High/Medium)
Gap by departments
• Compliance
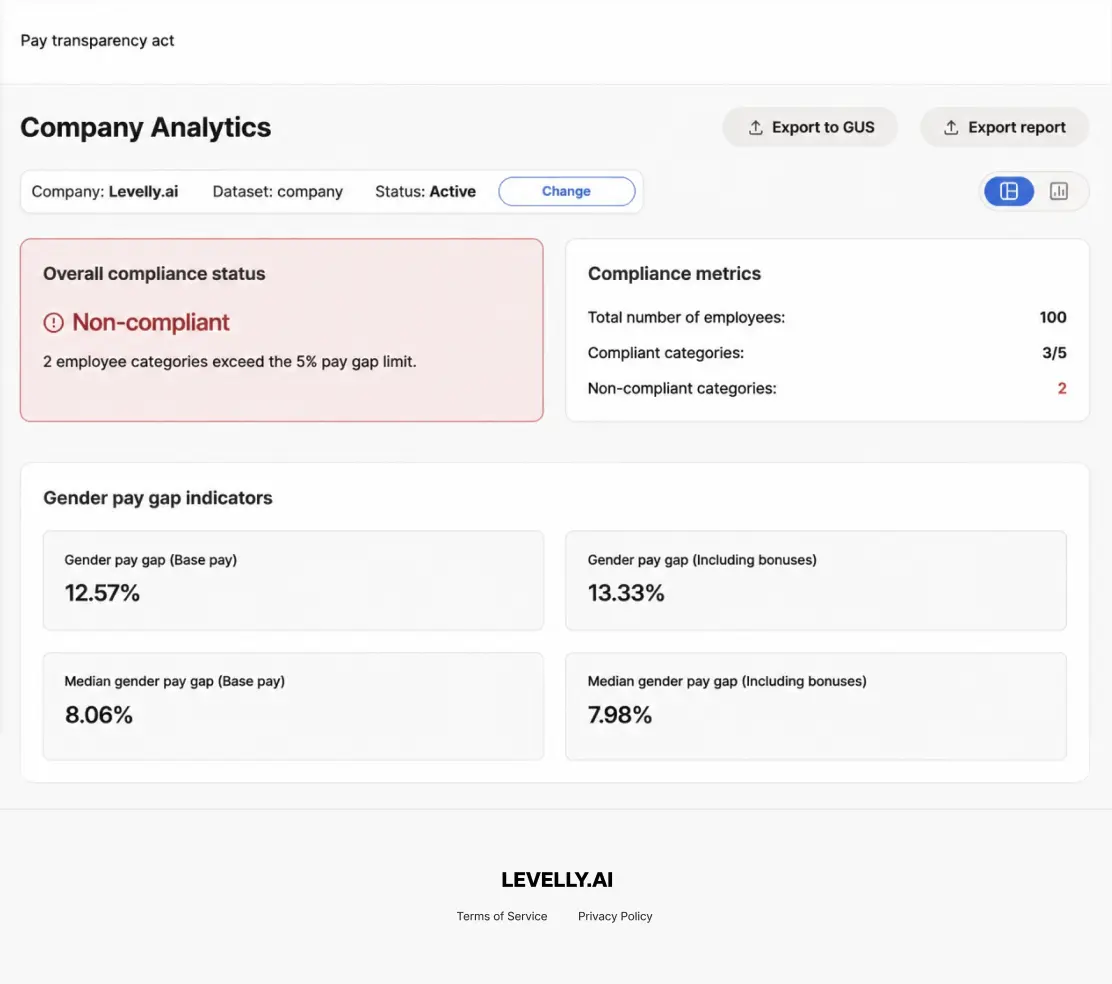
Dedicated EU Directive 2023/970 compliance view. Organisation status, legally required metrics, gap by job level with above-limit flags and report export
Overall compliance status (Non-compliant / Compliant)
Gender pay gap — base and base+bonus
% of employees receiving bonuses — W and M
Salary distribution in pay quartiles
Gap at the 5% threshold levels
Export report
• AI insights
An interpretation layer active in every platform view. AI displays conclusions inline — immediately after analysis, without exporting data to external tools

Book a 30-minute demo — we'll show you how the platform works with your data
Free Access. No Credit Card Required
Turning compensation data into clear, actionable pay equity insights — so you can ensure fair pay, stay compliant with EU Pay Transparency Directive, and build a more equitable workplace

Join us on LinkedIn

The “Levelly.ai” project has received funding from the European Funds under the Startup Booster for Social Impact program, implemented by the Polish Agency for Enterprise Development (PARP) in cooperation with SWPS University. The Levelly.ai platform enables companies to independently analyze and monitor the gender pay gap and identify its root causes. It is designed for organizations that want to operate in line with EU regulations and their internal values. The platform will be available in Poland and internationally. Total project value: PLN 198,758.95
The project is implemented under the European Funds for a Modern Economy 2021–2027 (FENG) program, Priority II, based on grant agreement no. FENG.02.28-IP.02-0003/23-00.
The company Levelly.ai PSA has received funding from European Funds under the Startup Spark 3.0 Acceleration Programme, implemented by the Łódź Special Economic Zone. The total project value is 200,000.00 PLN. The project is carried out under the European Funds for the Modern Economy programme, Priority II: An Environment Fostering Innovation, Action: Startup Booster Poland – Smart Up.
