
en

09.11.2026
|
Katarzyna Gapińska
A walkthrough of a sample Levelly.ai report: how each dashboard element maps to a Directive 2023/970 obligation and how to read the pay gap data behind it.
Pay transparency
Pay gap
Compliance
Written by

Katarzyna Gapińska
Co-founder of Levelly.ai
Table of contents
The report required by Directive 2023/970 is not a single number but a set of precisely defined metrics. Using a report generated in Levelly.ai, we show how each element of the dashboard maps to a specific obligation and how to read the data if you are responsible for implementation. The figures shown are illustrative.
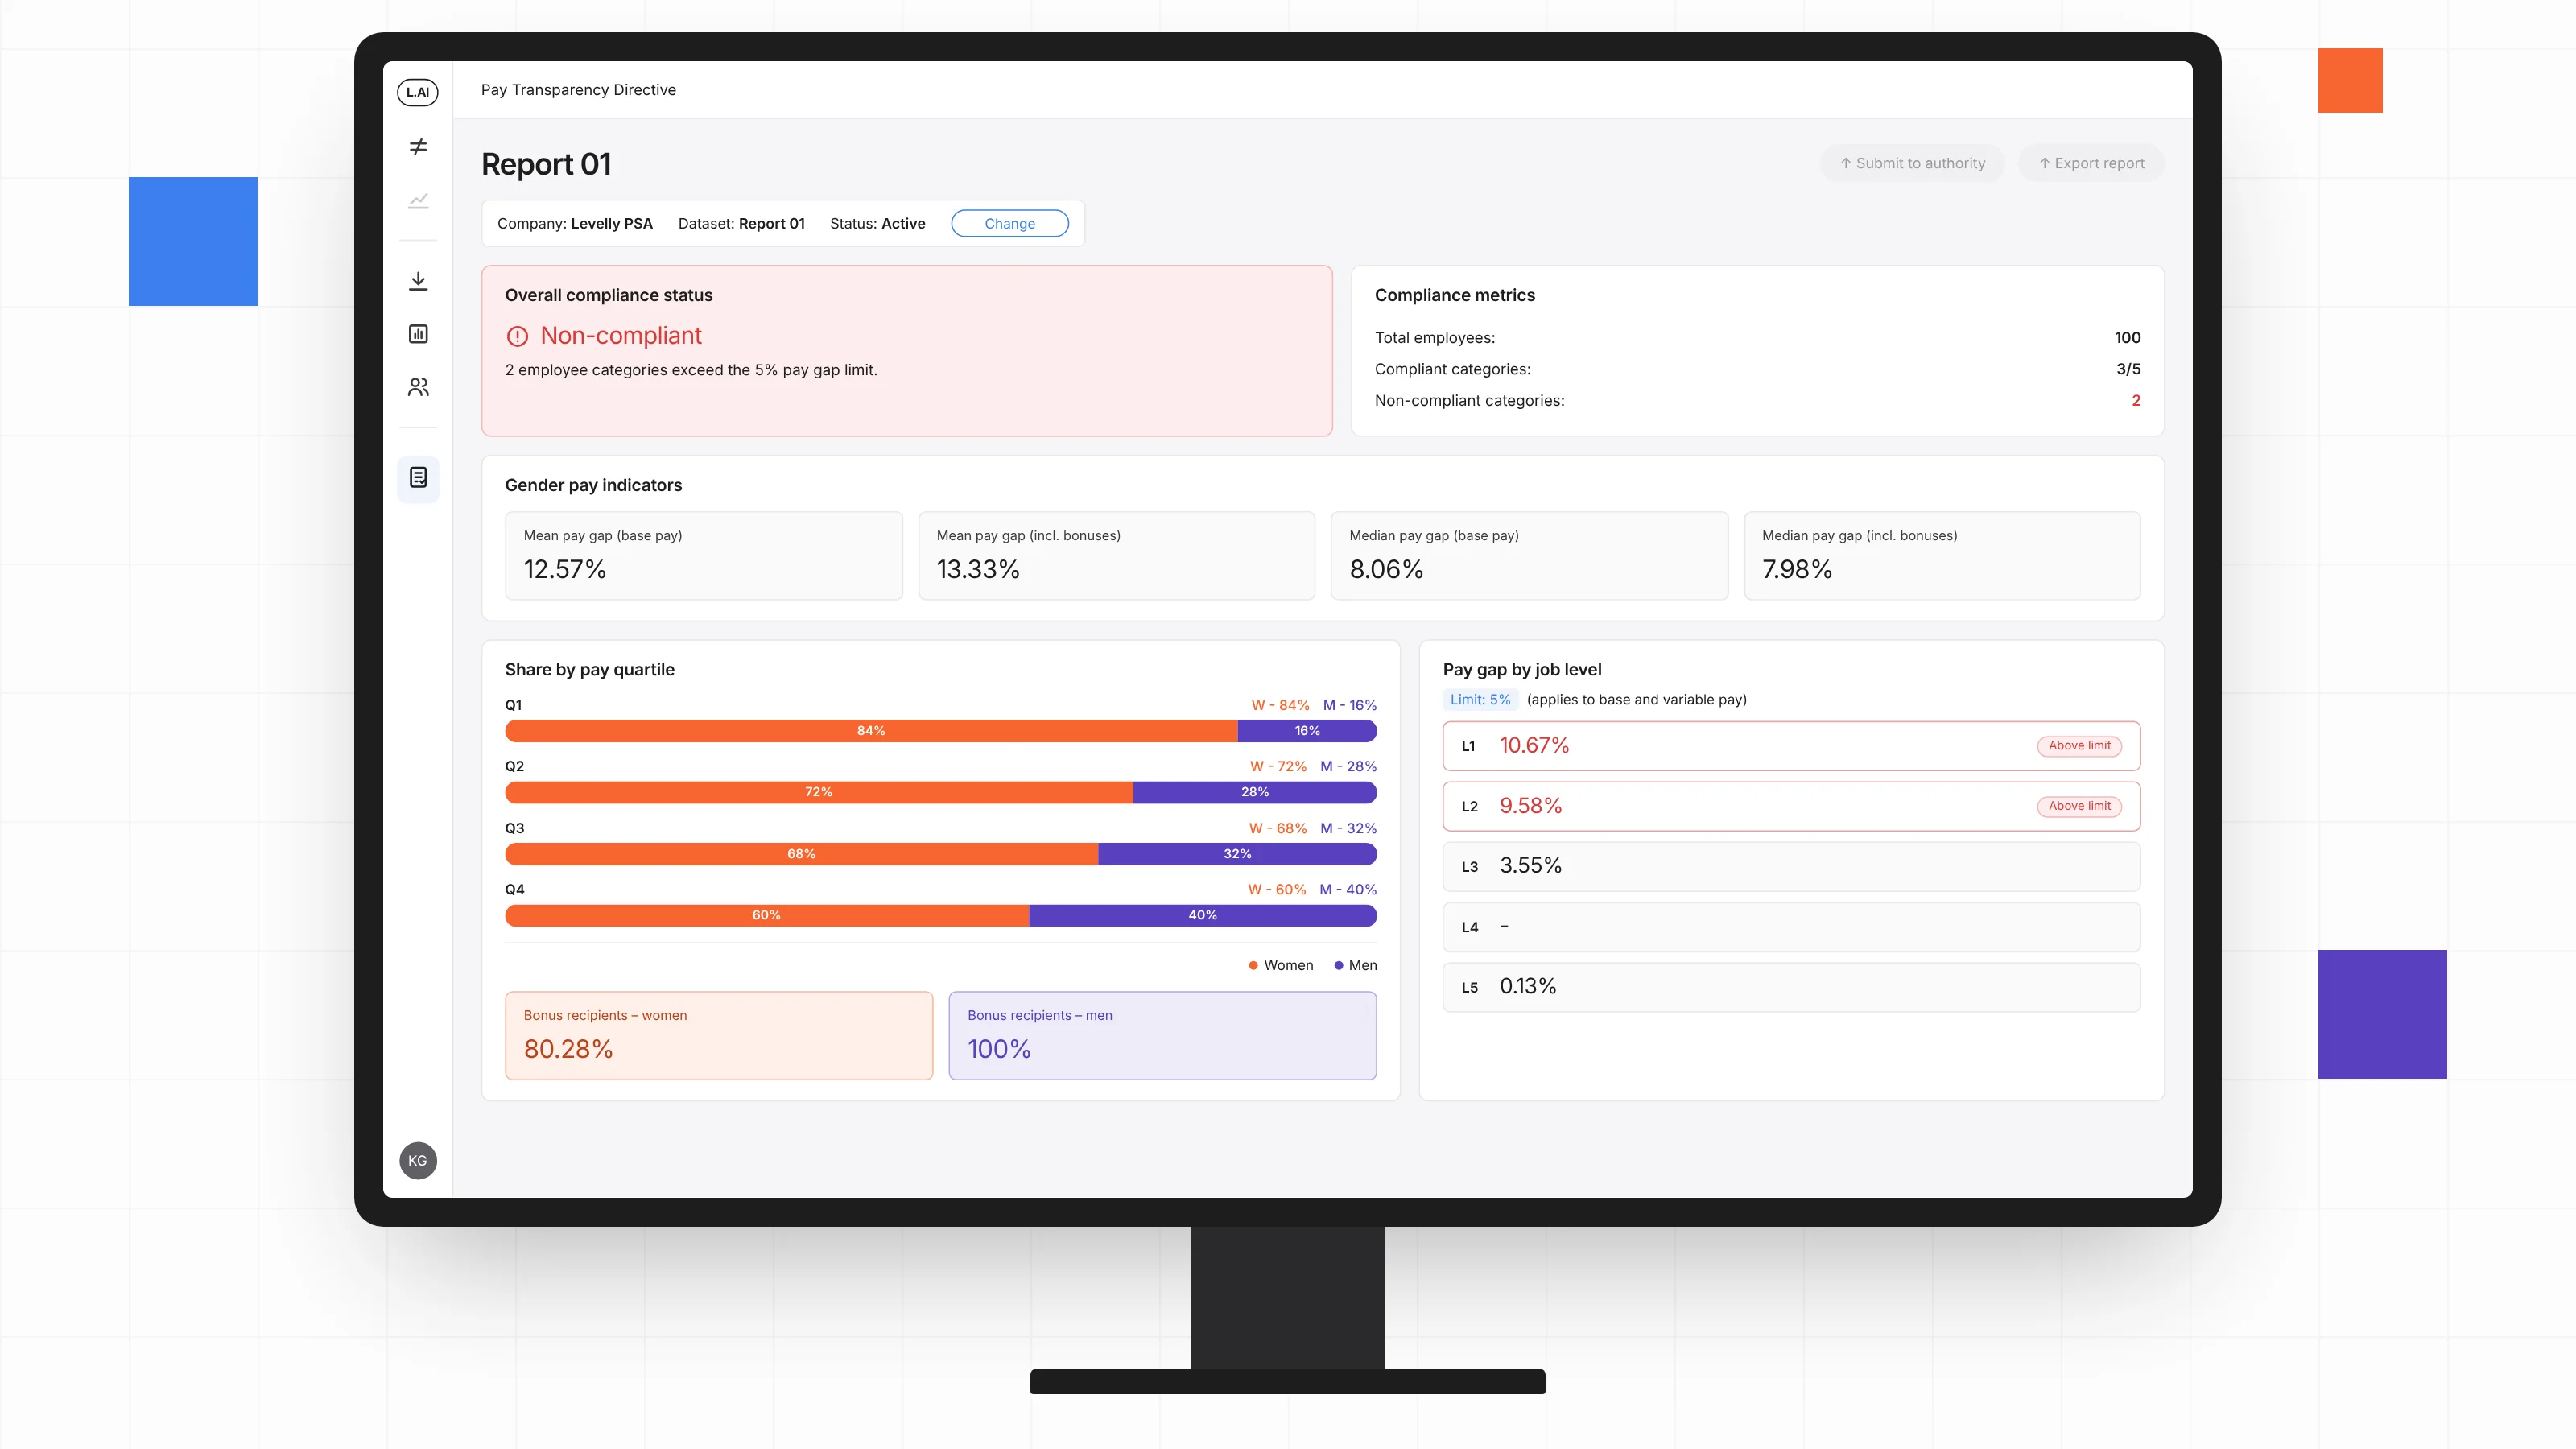
The report opens with a clear verdict — “Compliant” or “Non-compliant.” In the example, the status reads “Non-compliant,” noting that two worker categories exceed the 5% pay gap limit. Next to it are the compliance metrics: 100 employees, 3 of 5 categories compliant, 2 non-compliant.
This points directly to the mechanism in Article 10 of the directive: an unjustified gap of at least 5% in a given category triggers remedial action and, if not resolved in time, a joint pay assessment with worker representatives. The tool surfaces this signal immediately, instead of leaving you to hunt for it in a spreadsheet.
The report’s core is the set of metrics listed in Article 9 of the directive. The dashboard shows them in a single view (the seventh, the gap by category of workers, is discussed in the next section):
These metrics appear in the report because the directive requires them explicitly. The difference between the basic-pay gap (12.57%) and the gap including bonuses (13.33%) is a concrete clue: part of the inequality hides in variable components, not in base pay. The difference between the mean (12.57%) and the median (8.06%) shows that a few extreme cases push the result up — and that the mean alone is easy to misread.
The quartile distribution shows where women and men concentrate across the pay structure. In the example, women’s share falls from 84% in the first band to 60% in the fourth, which usually signals an overrepresentation of women in lower-paid roles and a reason to check the fairness of promotions and access to the best-paid positions.
The directive’s most important metric is the gap within groups of workers doing equal work or work of equal value. It determines compliance because the 5% threshold is calculated per category and covers both base pay and variable components. In the example, levels L1–L5 show:
Two categories (L1 and L2) exceed 5%, which drives the “Non-compliant” status. Importantly, the overall gap (12.57%) and the gap by category are two different values. Compliance is decided at the category level, not for the company as a whole. To calculate this metric at all, you first need job evaluation and the assignment of workers to comparable groups (here, levels L1–L5). Without it, there is no basis for compliant reporting.
The report is a starting point. From the dashboard, you can export a ready report and submit the data to the supervisory authority (in the example, “Submit to authority”). The dataset has its own status (“Active”) and name (“Report 01”), so you can return to successive versions and compare reports over time. For an implementation team, this means one thing: there is a single, repeatable path from raw HR data to a directive-compliant report, without assembling metrics by hand in a spreadsheet each reporting period.
Beneath the compliance view sit features that shorten the path from data to decision:
HR and Comp & Ben — treat the report as a task list, not a verdict: it shows which categories need explanation or correction first.
Legal and Compliance — the status and the per-category pay gap are your early-warning system before a joint pay assessment; make sure the reasons for differences are documented.
Leadership and CFO — two non-compliant categories are a quantifiable risk; the export function and report history let you show the company is in control of the process.
Article 9 requires reporting, among others, the pay gap and the gap in variable components, the medians of both, the share of women and men receiving variable components, the share of each sex in quartiles, and the gap by category of workers. The Levelly.ai dashboard shows all of these in one view.
By category of workers doing equal work or work of equal value, covering basic and variable pay. That is why a company can have a “decent” overall gap and still be non-compliant if a single category exceeds the threshold.
Because they measure different things. The overall gap compares all women with all men and reflects workforce structure. The per-category gap compares people doing comparable work — and it determines compliance.
No. Without job evaluation and assigning workers to categories, you cannot calculate the pay gap the directive requires. Pay data is the input; a consistent job architecture is the foundation.
The employer has time to justify the difference with objective criteria or to remedy it. If an unjustified pay gap is not removed in time, a joint pay assessment with worker representatives is triggered.
The figures in the sample report are illustrative and do not represent any real client’s data. The scope of metrics matches the reporting requirements of Article 9 of EU Directive 2023/970, while the 5% threshold and the joint pay assessment mechanism follow Article 10. Feature descriptions are based on the Levelly.ai platform.
Want to see a report like this for your organization? Check your compliance status under Directive 2023/970 on your own data.
See your report live — book a Levelly.ai demo.
The figures in the report are illustrative. © 2026 Levelly.ai.
Turning compensation data into clear, actionable pay equity insights — so you can ensure fair pay, stay compliant with EU Pay Transparency Directive, and build a more equitable workplace

Join us on LinkedIn

The “Levelly.ai” project has received funding from the European Funds under the Startup Booster for Social Impact program, implemented by the Polish Agency for Enterprise Development (PARP) in cooperation with SWPS University. The Levelly.ai platform enables companies to independently analyze and monitor the gender pay gap and identify its root causes. It is designed for organizations that want to operate in line with EU regulations and their internal values. The platform will be available in Poland and internationally. Total project value: PLN 198,758.95
The project is implemented under the European Funds for a Modern Economy 2021–2027 (FENG) program, Priority II, based on grant agreement no. FENG.02.28-IP.02-0003/23-00.
The company Levelly.ai PSA has received funding from European Funds under the Startup Spark 3.0 Acceleration Programme, implemented by the Łódź Special Economic Zone. The total project value is 200,000.00 PLN. The project is carried out under the European Funds for the Modern Economy programme, Priority II: An Environment Fostering Innovation, Action: Startup Booster Poland – Smart Up.
